Turn a report into a presentation
Upload the report as a PDF or Word file, say who the presentation is for, and Sliduno AI builds an editable PowerPoint deck from it. Financial tables stay as tables with their unit stated, a chart of the same numbers is added where it can be read plainly, and each point keeps a link to its source page.
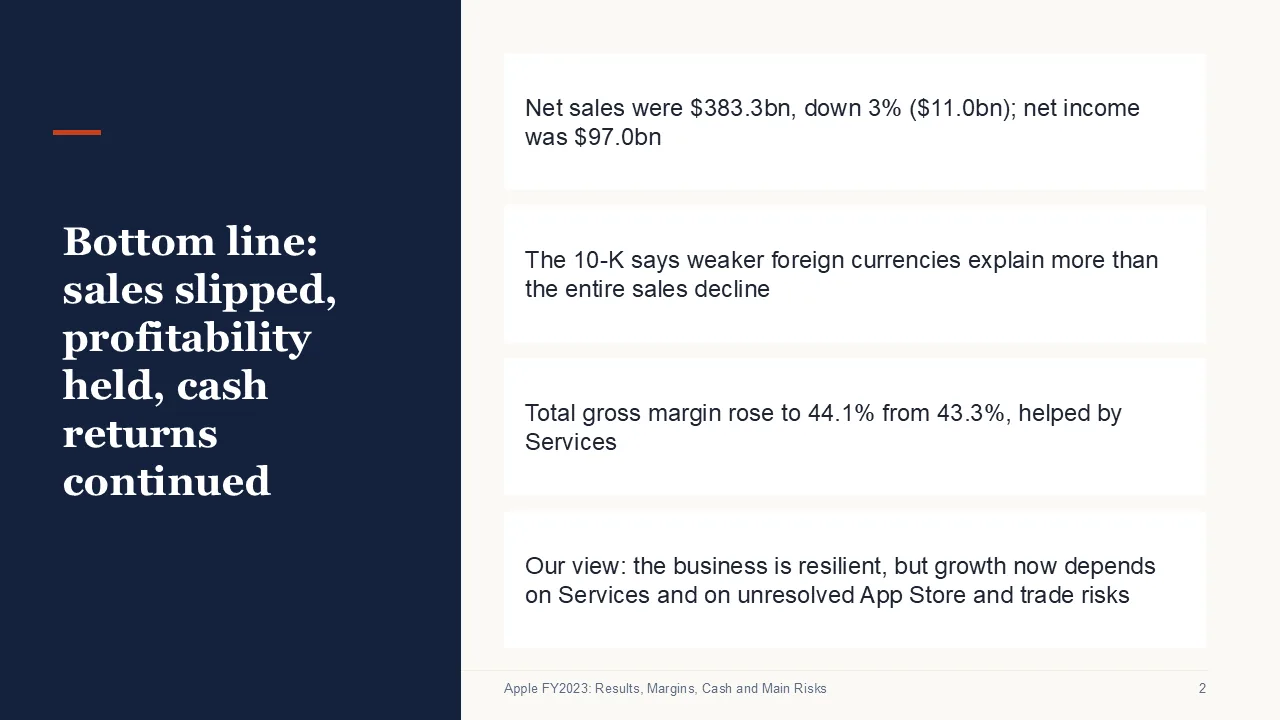
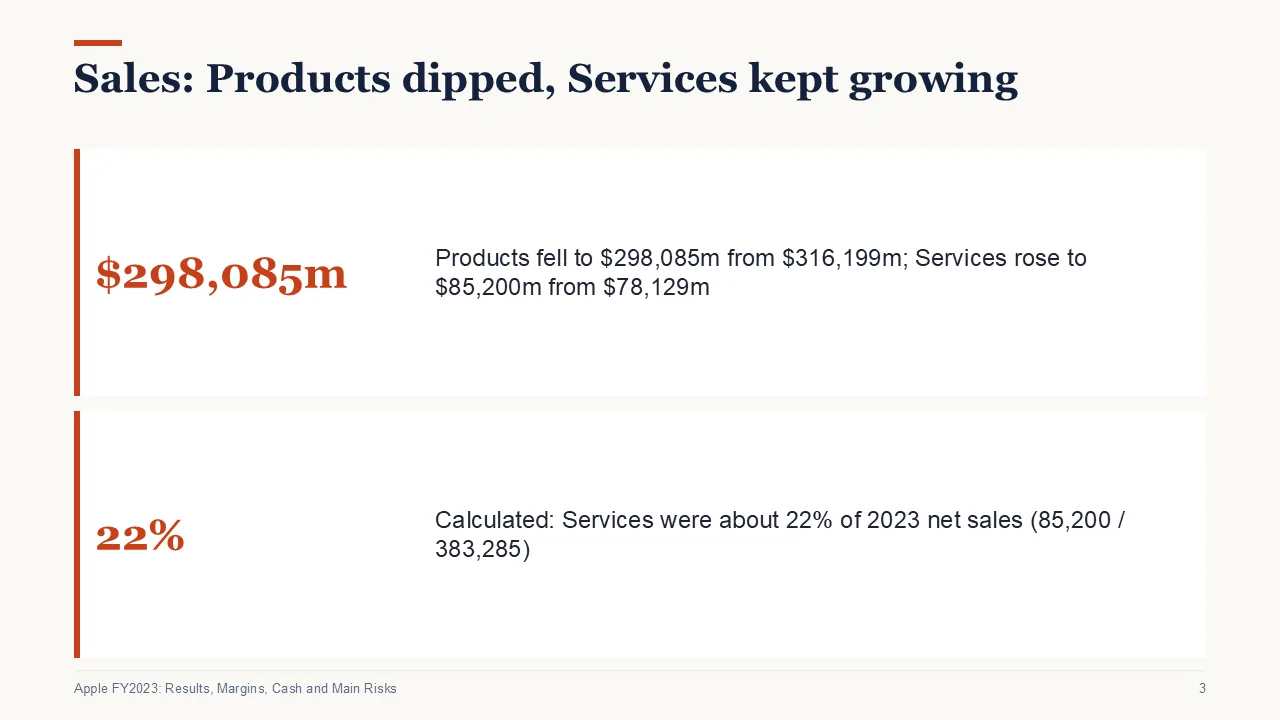
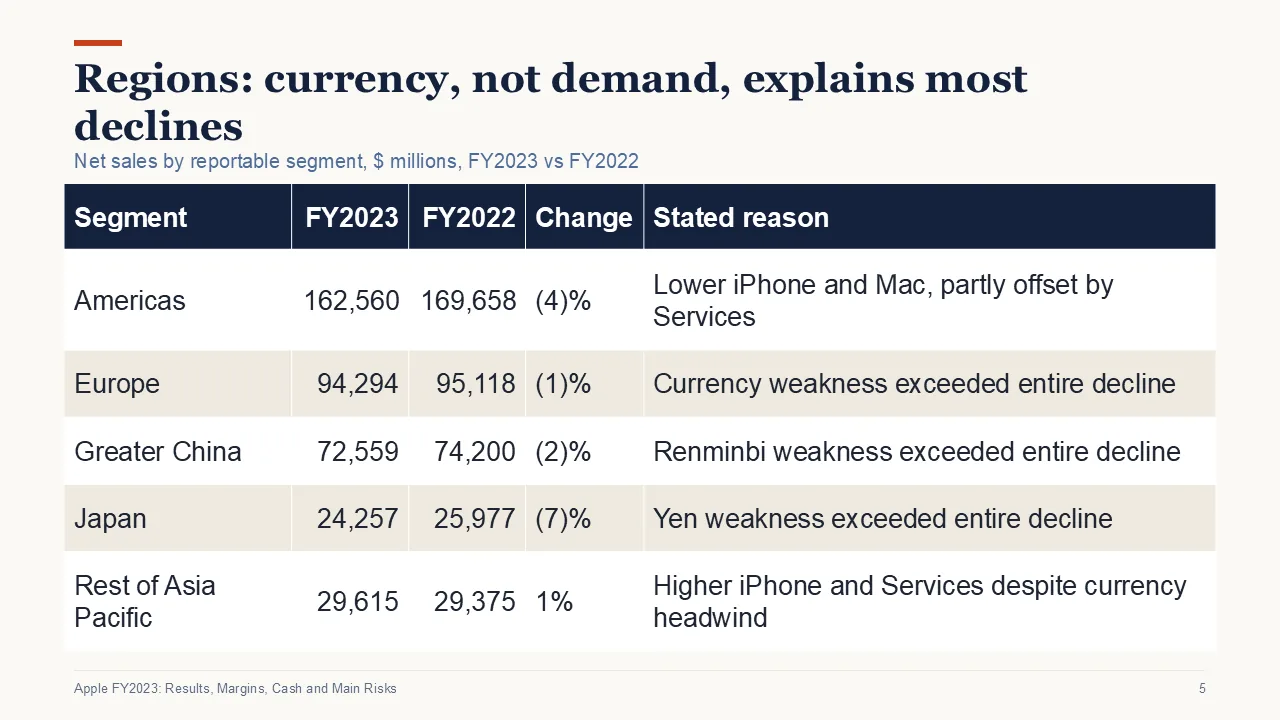
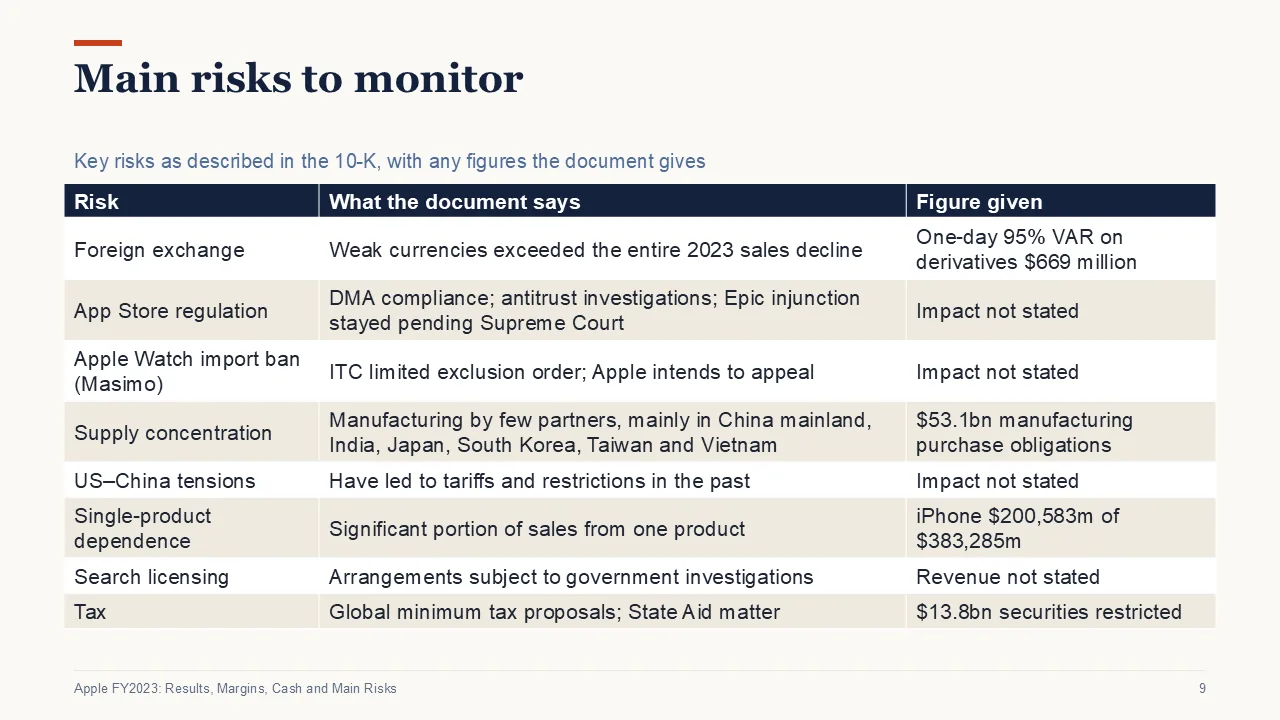
Built for documents where the numbers matter
Annual reports, board packs, budget requests and operations reviews are full of tables. Sliduno AI copies table figures as printed, marks totals, and leaves totals out of charts so nothing is counted twice.
A chart is added only when reading one is plain. A table that mixes percentages with amounts, or columns in different units, stays a table.
A short deck, not a copy
Ask for ten slides and the fullest sections are shown, with two slides kept for tables and charts. The editor lists what was left out, so nothing disappears silently. Filing labels like "Item 3" are dropped from slide titles.
One report, three formats
Every result can be downloaded as a PowerPoint deck, a PDF report or an Excel workbook with the document's tables in full.
How it works
- Upload the report. Add a PDF or Word file of up to 15 MB. PDFs are read up to 40 pages.
- Name the audience. For example: "Ten slides for the board. Focus on margin and cash. Skip the legal terms."
- Check and download. Each point shows its source. Change what you need, then download the .pptx.
Questions
How do I turn an annual report into a presentation?
Upload the report to Sliduno AI, say who the deck is for and how many slides you want, then check and download the editable PowerPoint. A report over 40 PDF pages is read up to page 40, so upload the part you need.
Will it invent numbers?
Table figures are copied from the document. In AI mode, numbers that cannot be found in the document are removed. In our test of 14 public PDFs, no table figure was invented or lost. Read the deck before presenting it.
Can it make charts from my tables?
Yes, where the table is plain: a label column and figures of one kind. The chart is a native PowerPoint chart with its data inside, drawn from the table's own numbers.
Is it free?
The version without AI is free to try. During early access, AI generations are limited per account, and every account has a limit on results in any 30 days. Nothing is on sale yet.
Related
Last updated 3 November 2026.